Volatility is a statistical measure of the tendency for the value of an asset’s price to move in either direction away from its average price over time.
If an asset has high volatility the price of the asset will be spread over a greater range of values, whilst low volatility suggests that the price deviates across a smaller range. An absolute return fund such as the TM Tellworth UK Select Fund shown in red below has low volatility, whilst a precious metals fund such as the BlackRock Gold & General Fund shown in blue has high volatility. This is because there are greater swings in price from the returns over a given time period.
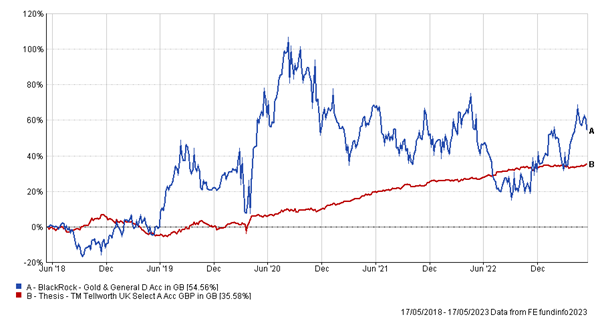
Source: FE Analytics, Total Return, Bid-Bid
The price of a structured investment is in part determined by the implied volatility of the underlying asset. Implied volatility is a measure of the expected range of price movements in the near future. For the probability models used to price the Financial Derivative Instruments (FDIs) present within structured investments, the implied volatility looks at the 34% most likely price movements in either direction, giving a span of the 68% most likely potential price movements at a given point in time.
The sensitivity to volatility of the FDIs within a structured investment is known as Vega. Academic studies suggest that the Vega within a structured investment is typically less than that of the underlying asset, and their pricing therefore tends to be less volatile than that of the underlying index. This is distinct from the additional risk exposure taken through the adoption of counterparty credit risk, and interest rate risk which also contribute towards the pricing of the structured investment.
Jonas Larsson, (2009), Risk Analysis of Structured Products.
Mohamed Osman Abdelghafour, (2009), Structured products: Pricing, hedging, and applications for life insurance companies.
As an example, below we show the secondary market bid pricing of two structured investments, which showed lower volatility than the underlying asset. These two structured investments are options 1 and 2 of the Mariana Capital 10:10 Plan May 2019 and these are shown against the returns of the FTSE 100 Index and FTSE 100 Total Return Index.
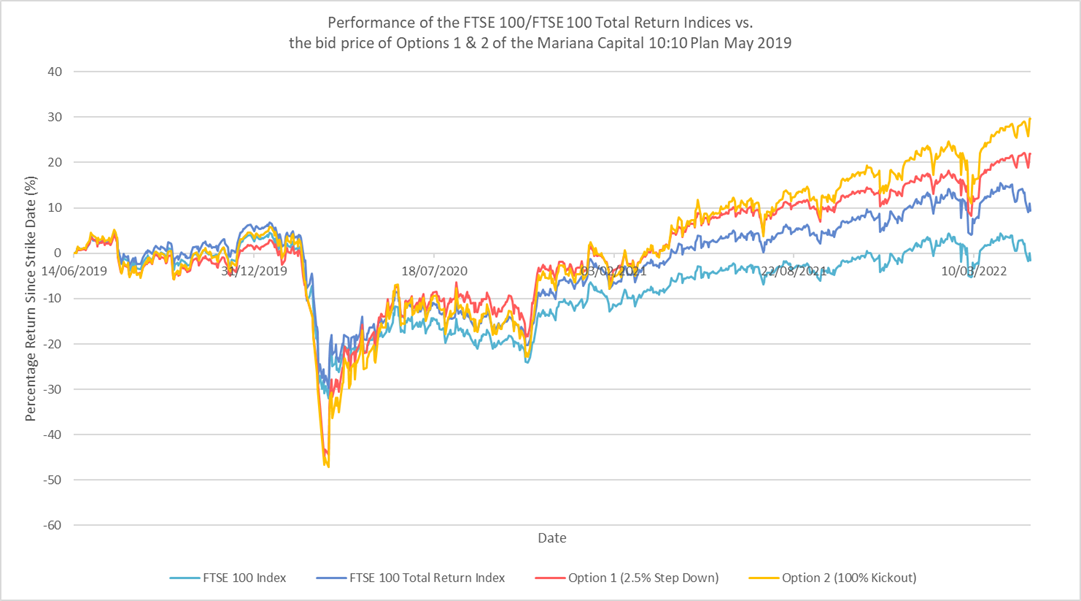
Source: FE Analytics, Lowes Financial Management Ltd
Whilst the performance and volatility at the beginning of the term is similar, we see that over time the volatility of these two structured products is less than that of the FTSE 100 Index.
Volatility within the Lowes UK Defined Strategy Fund
As well as affecting the pricing of a structured investment, volatility also affects the potential returns offered by structured investments. This can be demonstrated by comparing two strategies contained within the Lowes UK Defined Strategy Fund (the “Fund”) which, despite having the same shape (i.e. same maturity reference level being the initial level; frequency of early maturity observations and capital protection barrier) began at different times, when volatility in both the FTSE 100 Index and the FTSE Custom 100 Synthetic 3.5% Fixed Dividend Index (FTSE CSDI) was very different.
Strategy 32, a gilt-backed strategy, offered an 8.08% return for each year held, maturing on the first of the pre-defined observation dates that the FTSE CSDI was above the initial index level (163.56).
Strategy 54, also a gilt-backed strategy has similar maturity parameters albeit with an initial index and maturity trigger level of 167.98 but offered a higher potential 10.16% return for each year held.
Whilst these two strategies had some differing factors, the large variance in return offered can largely be attributed to the volatility of the underlying asset (the FTSE CSDI) at the time they were structured. Volatility was lower in November 2021, when strategy 32 was created, than it was in March 2023, when strategy 54 was introduced. For more details on the specifics of all of the fund strategies utilised in the Lowes UK Defined Strategy Fund and referenced in this article, please visit UKDSF.com/Portfolio.
So, whilst structured investment terms can vary according to volatility in the underlying measure, over the medium to long term their pricing tends to be less volatile than the underlying index itself. It is this that Lowes Investment Management Ltd (as investment manager) plans to take advantage of within the Lowes UK Defined Strategy Fund. Recycling existing investments when volatility leads to better returns being offered, whilst benefitting from the reduced volatility in the pricing of the underlying strategies as the portfolio matures. This strategy is completely at the discretion of Lowes Investment Management Ltd as investment manager to the fund, and other factors may mean that this strategy is not the chosen course of action.
If you would like to know more about the Lowes UK Defined Strategy Fund, please visit the Fund website UKDSF.com/Literature for the Key Investor Information Document (“KIID”), Prospectus, and Supplement or call Lowes Investment Management on 0191 281 88 11.
Further Information:
This article is for information purposes only and should not be construed as advice. We strongly suggest you seek independent financial advice prior to taking any course of action.
The value of this investment can fall as well as rise and investors may get back less than they originally invested. Past performance is not necessarily a guide to future performance.
The Fund is suitable for investors who are seeking capital growth over a medium to long term horizon but who are willing to tolerate medium to high risks due to the potentially volatile nature of the investments.
The Lowes UK Defined Strategy Fund is a sub-fund of the Skyline Umbrella Fund (ICAV) and is regulated by the Central Bank of Ireland. The KIID, Prospectus, and Supplement can be accessed by visiting UKDSF.com/Literature and are only available in English.
Lowes Investment Management Ltd, Fernwood House, Clayton Road, Newcastle upon Tyne, NE2 1TL. Authorised and regulated by the Financial Conduct Authority.